Rethinking unsupervised network anomaly detection: when a rigorous protocol brings perfect scores down to earth
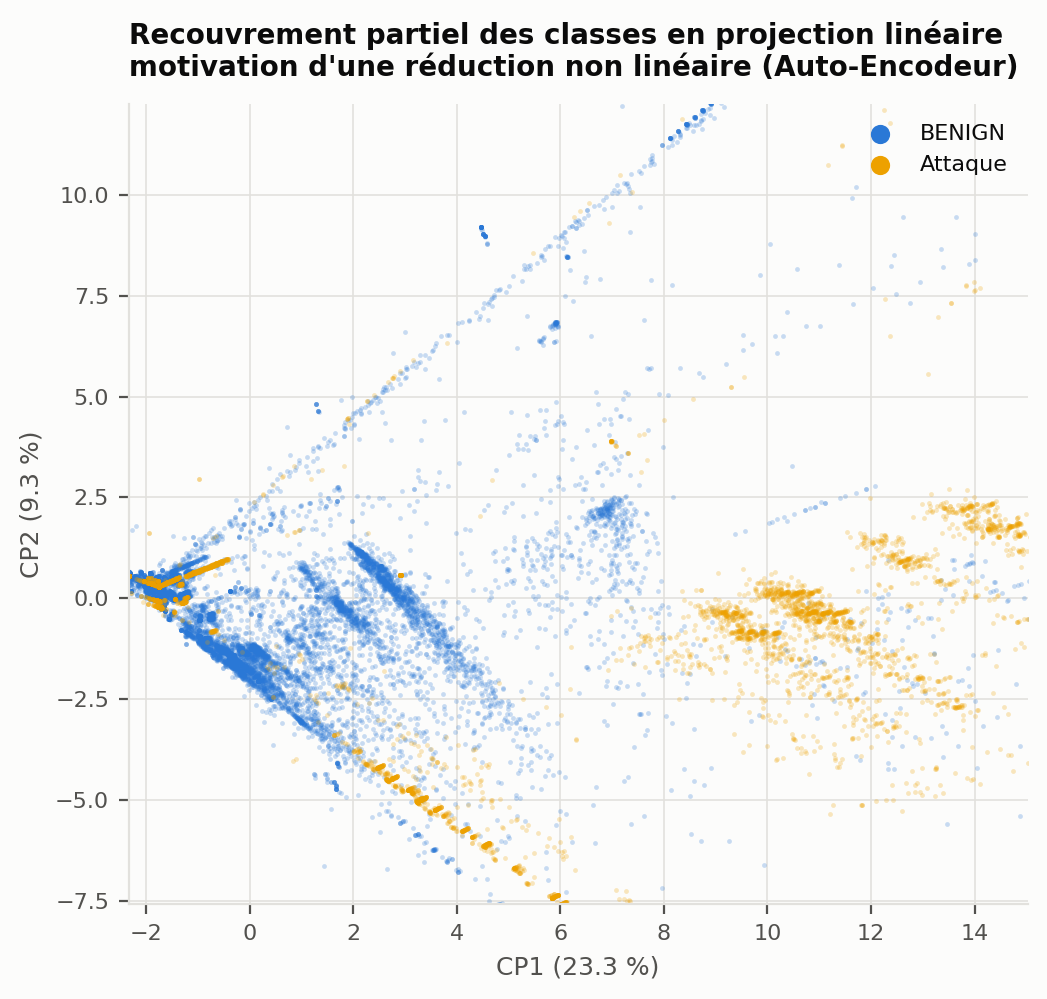
In short: evaluated under a leakage-free protocol on CICIDS2017, the Autoencoder + Isolation Forest architecture reaches modest real performance (PR-AUC ≈ 0.70), far from the near-perfect scores often reported. Three findings stand out: 99.6% of malicious flows are identifiable from the source IP address alone, the autoencoder's non-linear reduction does not beat a plain PCA, and benign traffic drifts over the week to the point of invalidating any fixed threshold.
Why this work
The growing volume of traffic and the sophistication of attacks, particularly zero-day ones, expose the limits of detection systems based on signatures or on supervised models that depend on labelled data. Unsupervised approaches promise to detect the unknown without labels, and the hybrid Autoencoder + Isolation Forest architecture is regularly presented as strong for this problem.
This work grew out of a simple methodological discomfort: the near-perfect scores reported on CICIDS2017 do not square with the intrinsic difficulty of detecting anomalies without labels. Rather than take those numbers for granted, we put them to a deliberately stricter protocol. The results are less spectacular, and far more instructive.
A dataset to handle with care
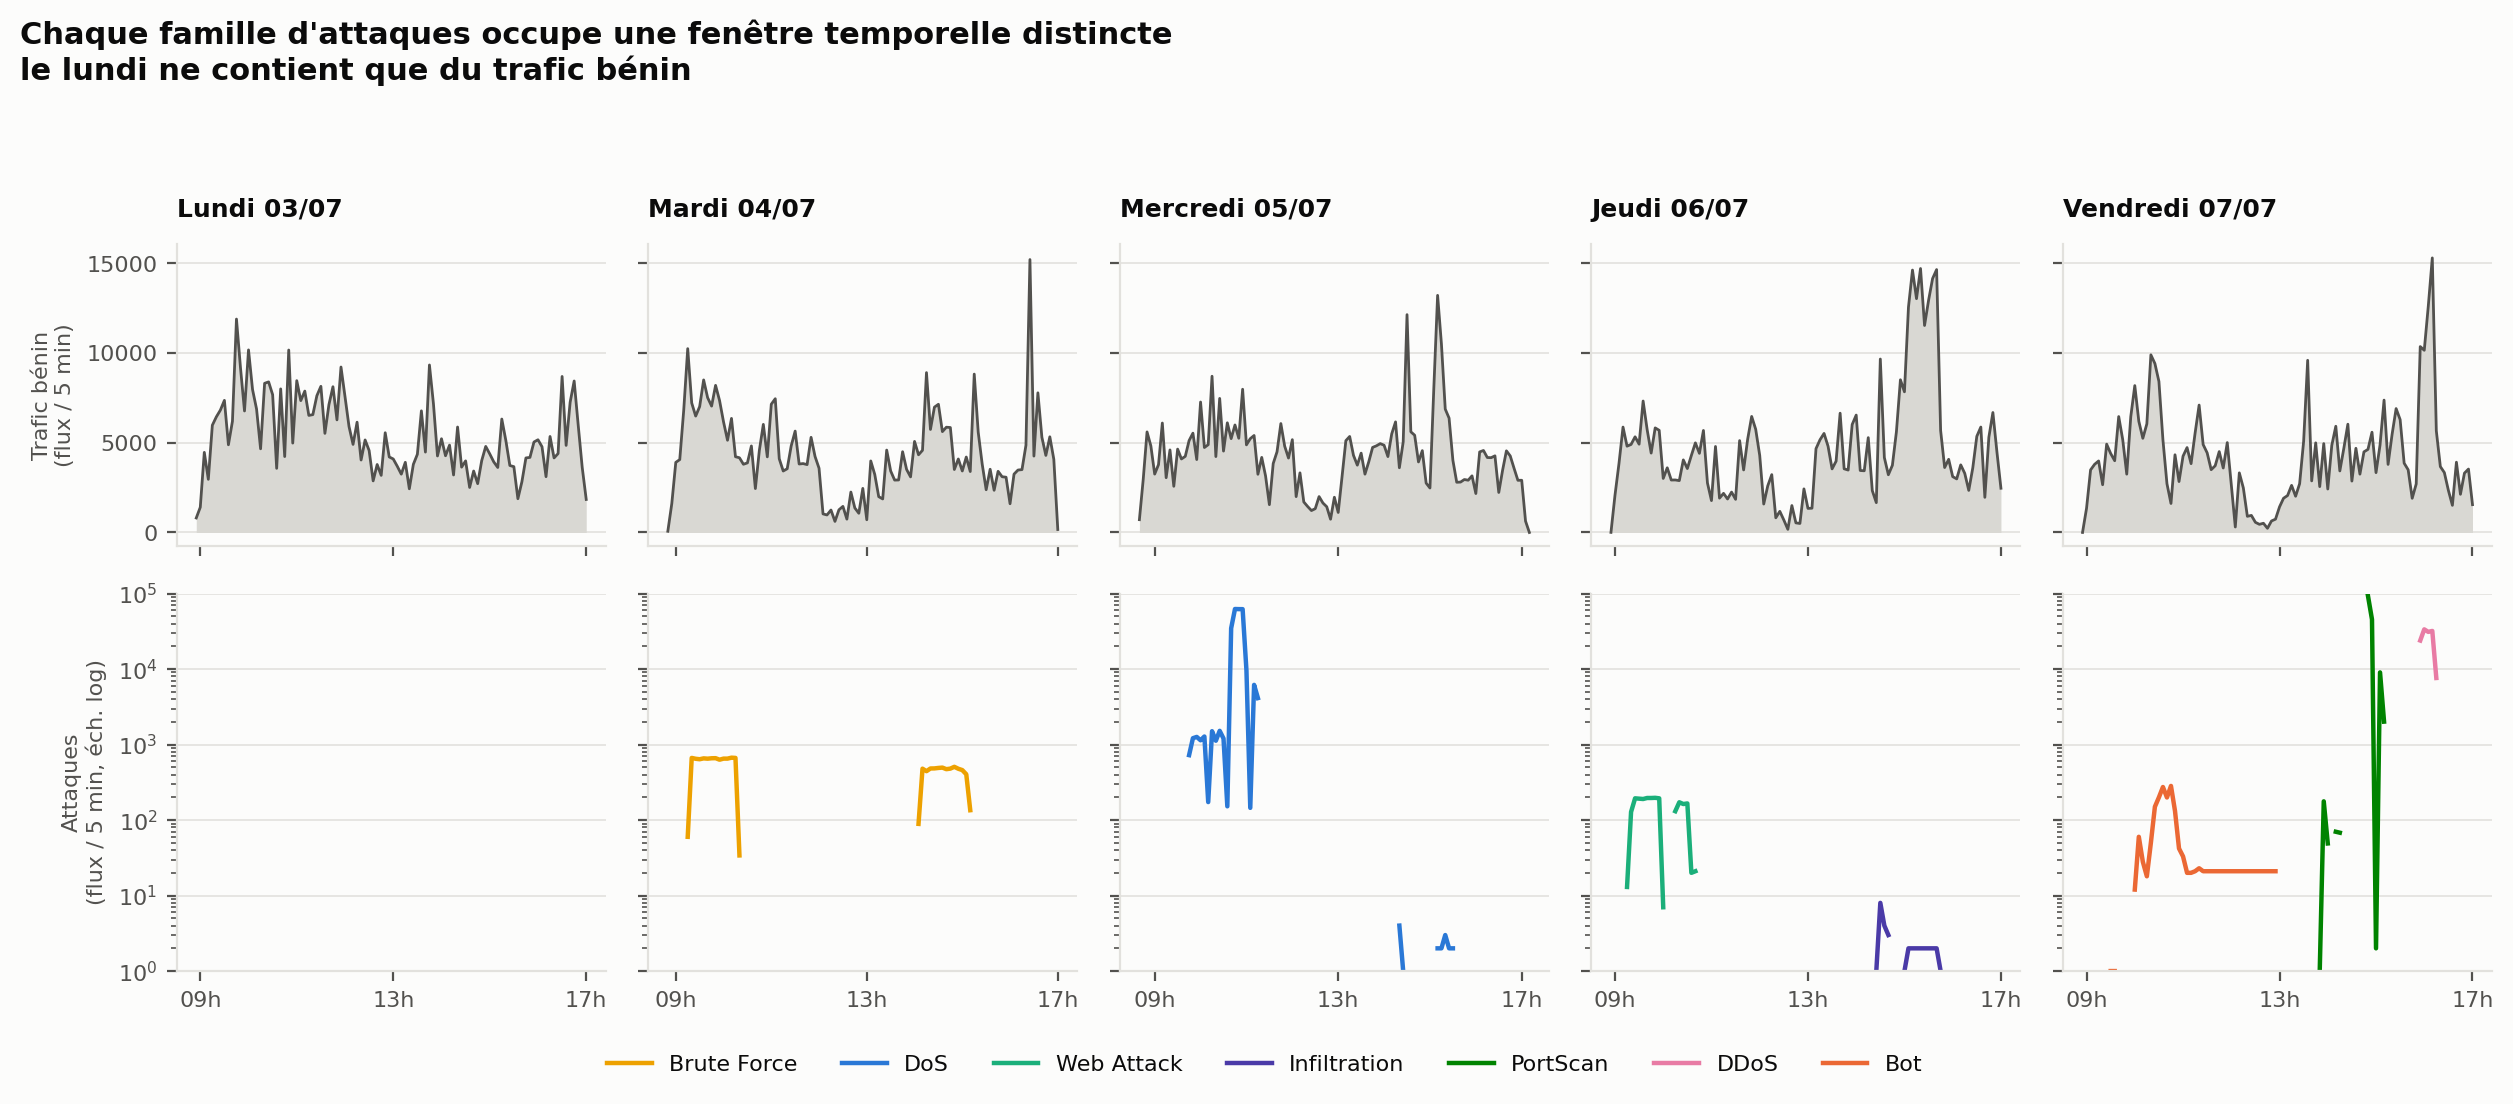
CICIDS2017 reproduces five working days of traffic, Monday to Friday. Each attack family occupies a distinct time window, and Monday contains no malicious flow, which directly provides a pure benign training set. The dataset holds 2,830,743 flows, 80.3% of which are benign, but naive use is a trap: entirely empty rows, inconsistent encodings, timestamps on a twelve-hour clock with no AM/PM marker that break chronological order.
Finding 1: leakage through identifiers
The analysis of each column's predictive power is unambiguous. The mutual information between the source IP address and the label reaches 0.486, against 0.334 for the best behavioural feature (Average Packet Size). More strikingly, 99.64% of malicious flows come from a single source IP address.
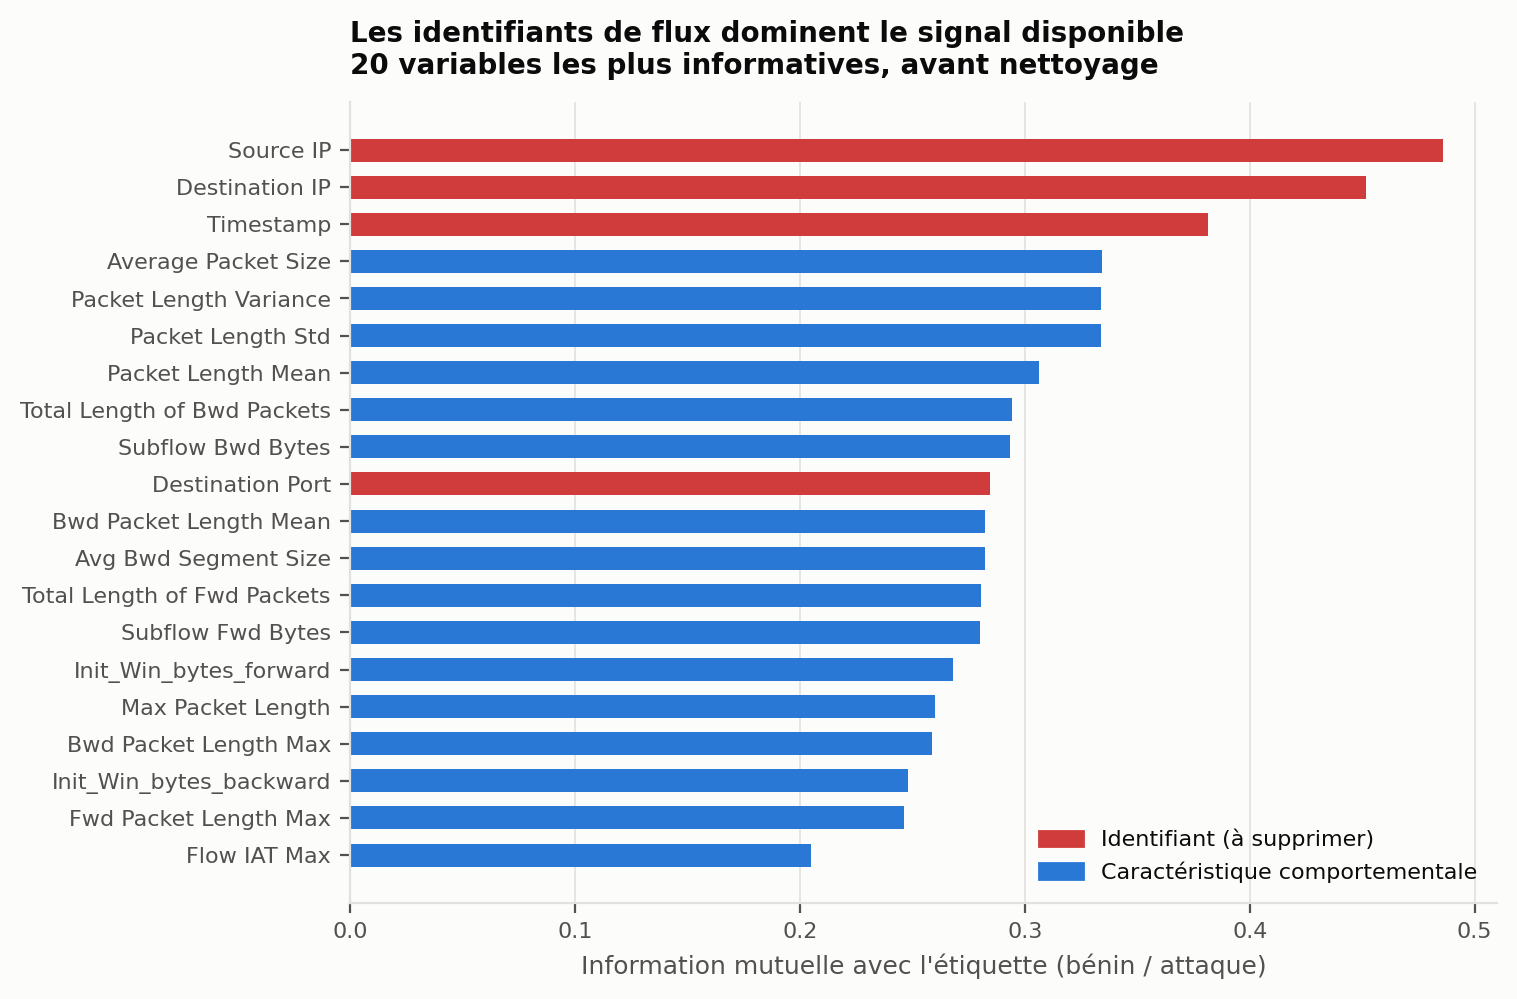
A trivial rule, "if the source IP is X then attack", reaches a recall above 0.99 without learning anything about network behaviour. Keeping these columns means measuring memorisation of the benchmark, not anomaly detection. We therefore drop Flow ID, Source IP, Destination IP, Source Port and Timestamp.
A leakage-free evaluation protocol
We apply three safeguards: removing identifiers, exact deduplication performed before the split (330,766 duplicates removed), and a strictly temporal split. Normalisation is fitted once, on benign training traffic only, then applied to the other sets. 66 input features remain.
| Set | Origin | Benign | Attacks | Use |
|---|---|---|---|---|
| Training | Monday (80%) | 394,017 | 0 | Learning |
| Validation | Monday (20%) | 98,504 | 0 | Threshold calibration |
| Test | Tuesday to Friday | 1,578,881 | 425,593 | Final evaluation |
Finding 2: the non-linear latent space does not win
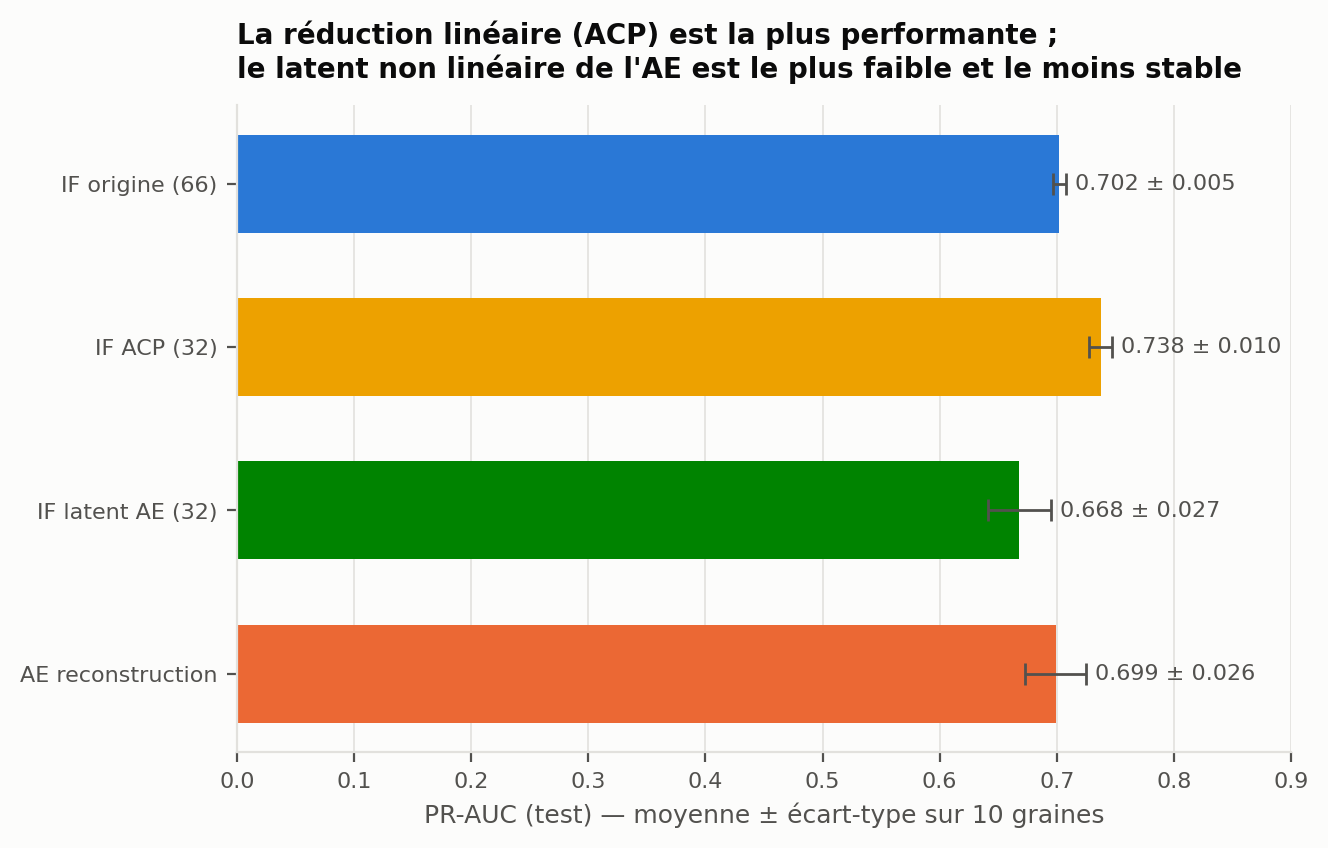
Over ten independent runs, we compare the Isolation Forest applied to three representations, plus the autoencoder's reconstruction error. The result is surprising: the projection into the non-linear latent space is the least performant and least stable representation. A plain linear reduction by principal component analysis (PCA) does significantly better (Δ = +0.069, Cohen's d = 2.1, p = 0.012 after correction).
| Method | PR-AUC | ROC-AUC |
|---|---|---|
| Isolation Forest, PCA (32) | 0.738 ± 0.010 | 0.946 ± 0.003 |
| Isolation Forest, original features (66) | 0.702 ± 0.005 | 0.949 ± 0.001 |
| Autoencoder, reconstruction error | 0.699 ± 0.026 | 0.937 ± 0.004 |
| Isolation Forest, AE latent (32) | 0.668 ± 0.027 | 0.930 ± 0.009 |
The explanation lies in the training objective: an autoencoder learns to reconstruct, not to separate. Its latent space optimises compression fidelity of normal traffic, with no guarantee that attacks become more isolable there, whereas PCA precisely preserves the axes of greatest variance, the very ones that carry the volumetric deviations characteristic of most attacks.
Calibrating the threshold on benign traffic
An anomaly score is not a decision: a threshold is needed. Rather than assuming the proportion of attacks is known, we calibrate the threshold on a quantile of the benign validation scores. The parameter α, the tolerated false-alarm rate, then becomes a direct operational setting: the alert budget a security centre can absorb.
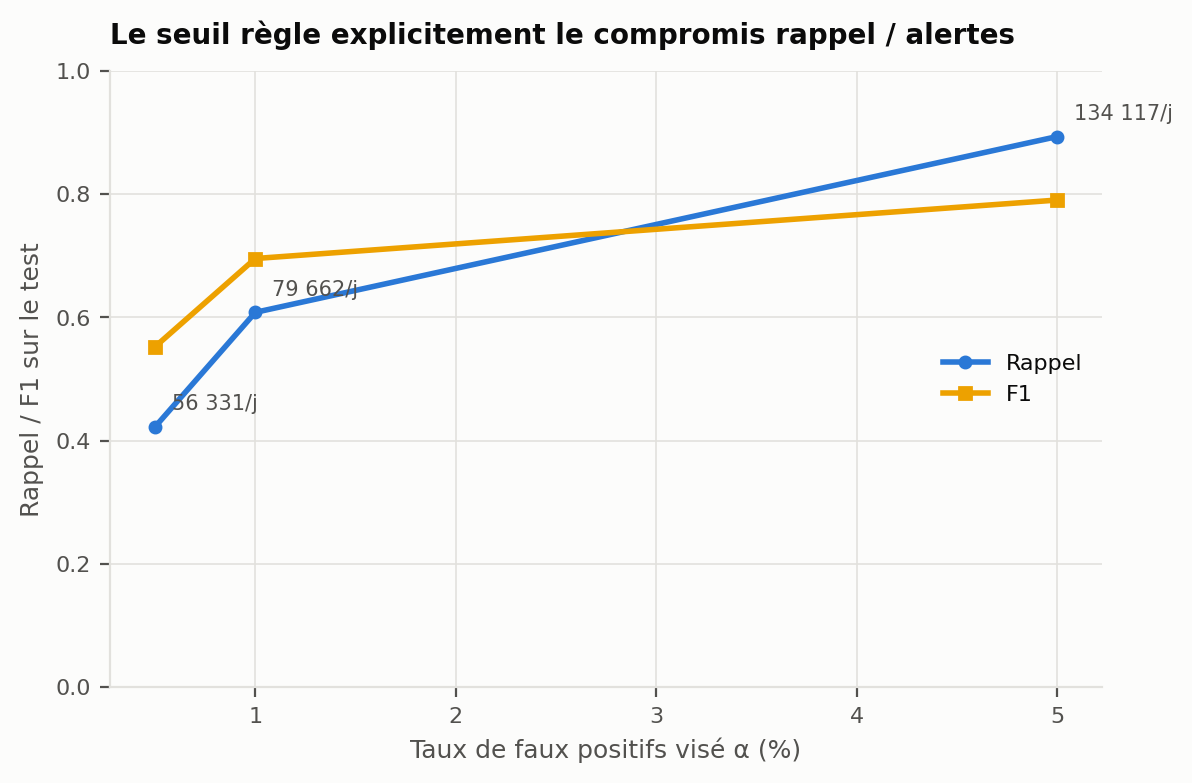
| Target α | Threshold τ | Real FPR | Recall | Precision | F1 | Alerts/day |
|---|---|---|---|---|---|---|
| 5% | 0.00094 | 9.9% | 0.893 | 0.709 | 0.790 | 134,117 |
| 1% | 0.00254 | 3.8% | 0.608 | 0.812 | 0.695 | 79,662 |
| 0.5% | 0.00333 | 2.9% | 0.422 | 0.798 | 0.552 | 56,331 |
Finding 3: benign traffic drifts
Calibrating on Monday assumes benign traffic stays stable in the following days. The temporal split lets us check that assumption, which a random split makes impossible. The mean reconstruction error of benign traffic is multiplied by nearly five between Tuesday and Friday, and the Population Stability Index (PSI) crosses the drift threshold as early as Thursday.
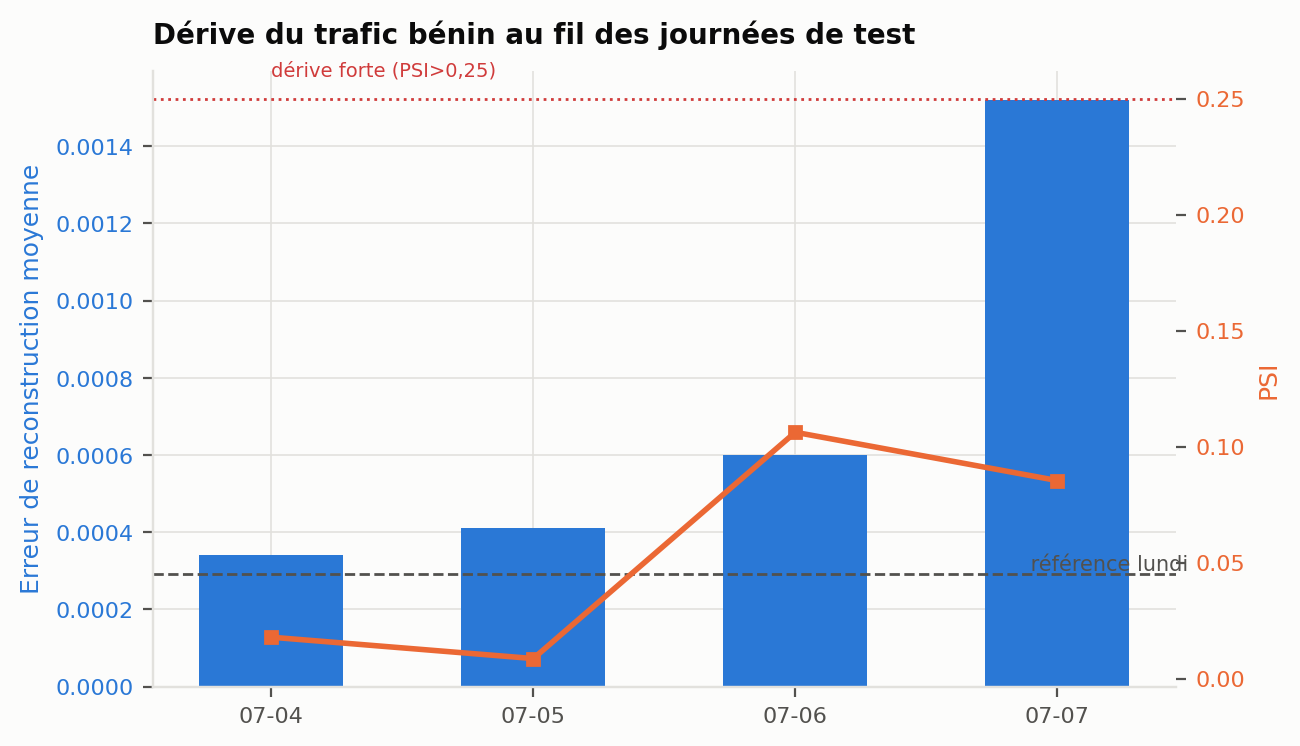
This drift directly explains why the real false-positive rate (3.8%) exceeds the target (1%): the threshold calibrated on Monday underestimates the scores of the following days. A threshold fixed once and for all is structurally insufficient; periodic recalibration is not an optional refinement but a necessity revealed by the data itself.
What the method catches, and what escapes it
The detection profile is consistent with the nature of the approach: volumetric attacks, which clearly deviate from normal traffic in volume and rate, are mostly detected; stealthy attacks, which mimic legitimate sessions, almost entirely escape the detector.
| Attack family | Flows (test) | Recall |
|---|---|---|
| DoS (Hulk, GoldenEye, slowloris…) | 193,597 | 0.764 |
| PortScan | 90,694 | 0.600 |
| DDoS | 128,014 | 0.438 |
| Bot | 1,948 | 0.102 |
| Web attack (Brute Force, XSS, SQLi) | 2,143 | 0.041 |
| Brute force (FTP, SSH-Patator) | 9,150 | 0.000 |
Explainable alerts, at no extra cost
A deployed detector must justify its alerts. The autoencoder provides that explanation for free: for each alerted flow, the per-feature reconstruction residual points to the characteristics most responsible for the deviation from normal behaviour. A DoS Hulk alert is thus driven by an unexpected FIN flag and irregular inter-arrival times, a DDoS alert by an abnormally large packet size. This explanation stays descriptive: it names the anomalous variables without establishing a formal causal link.
What we take away for practice
The value of a detection system lies not in a record score, but in its operational honesty: a threshold with explicit meaning, explainable alerts, and drift monitoring that answers a real phenomenon measured in the data. These three requirements, adaptive calibration, explainability and drift monitoring, are exactly the ones we place at the heart of our detection systems.
Beyond the method, this work argues that intrusion-detection evaluations should be conducted with the same rigour as the architectures. Without control of leakage, redundancy and temporal structure, the reported performance measures the benchmark rather than the real detection capability.
The full code and artefacts allow the results to be reproduced exactly. A rigorous negative result is worth more than a perfect score that does not survive contact with reality.